Career Journeys blend live, on-demand, hands-on, and collaborative learning methods into one topic-specific skilling program. Each Career Journey enables learners to master mission- and job-critical skills and drive meaningful business transformation year-after-year. Career journeys comprise specially curated Aspire Journeys. If you added any of the available Career Journeys to Percipio, you can now assess its value through the Career Journey dashboard. You can answer questions such as:
- How many learners consumed a Career Journey license?
- How many learners accessed the Career Journey content?
- How many learners completed a journey?
- How many learners started a journey?
- What journeys and tracks did learners access?
- How much time did learners spend learning?
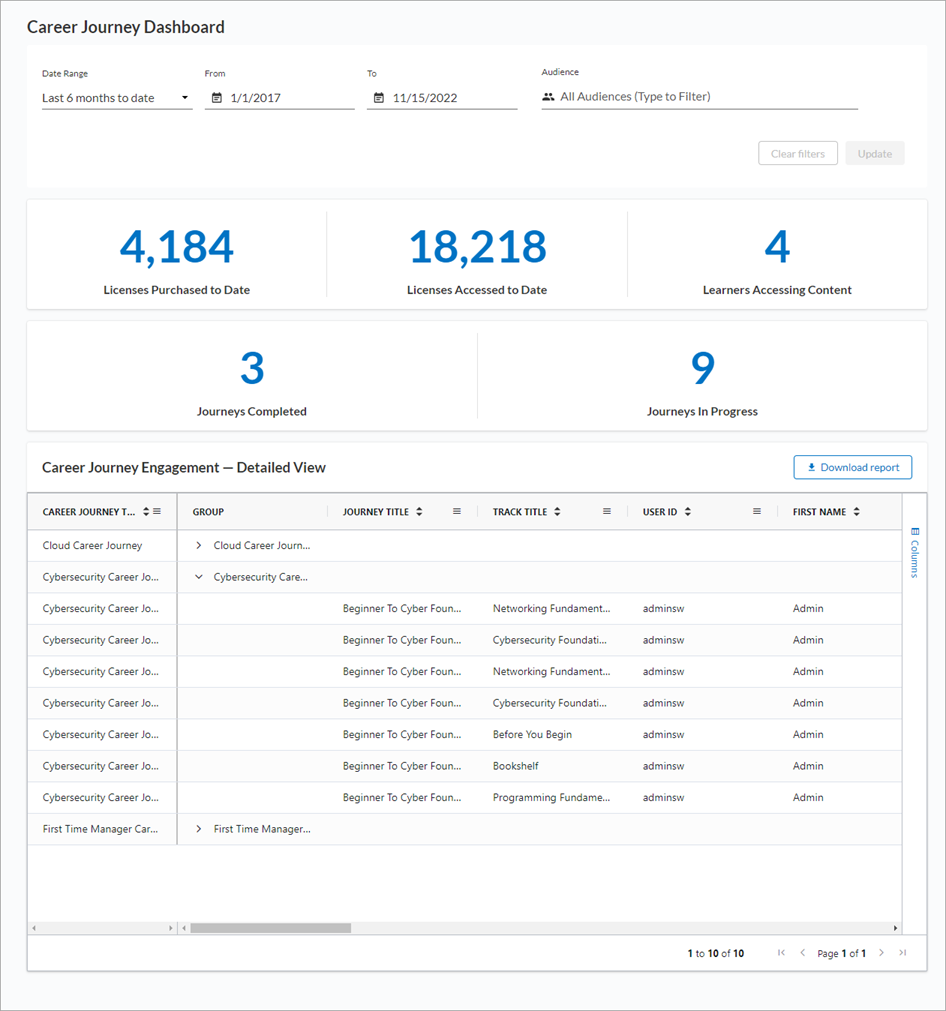
Access the Dashboard
To access the Career Journey Dashboard: from the Analytics menu, select Career Journey. The dashboard page displays.
To make the most out of this report, we recommend the following:
Available Columns
Columns displayed by default
The following columns are displayed by default in the Career Journey report:
- CAREER JOURNEY TITLE: The title of the Career Journey.
- GROUP: The report groups all Aspire Journeys into their corresponding Career Journey. Expand the data in this column to see specific Aspire Journey and track details for each Career Journey.
- JOURNEY TITLE: The title of the journey.
- TRACK TITLE: The title of a track within the journey.
- USER ID: The value entered in the User ID attribute. It is used to identify a user inside Percipio.
- FIRST NAME: The value entered in the First name user attribute. Usually the user's first name.
- LAST NAME: The value entered in the Last name user attribute. Usually the user's last name.
- USER STATUS: The status of the user, Active or Inactive.
- JOURNEY START DATE: The date the learner began the journey. This date is not impacted by the Date Range Presets filter, and the time stamp of t00:00:00Z is expected.
- JOURNEY LAST ACCESS DATE: The date the learner last accessed the journey.
- JOURNEY COMPLETED DATE: The date the user completed the content. This date is not impacted by the Date Range Presets filter.
- JOURNEY PROGRESS: The percent completion that the learner is through the journey.
- JOURNEY STATUS:The learners status of the journey, either In progress or Completed.
- TRACK PROGRESS: The percent complete that the learner is through the track.
- TRACK STATUS:The learners status of the track, either In progress or Completed.
- TOTAL LEARNING HOURS (HOURS): The total number of hours a learner spent learning in this content item. If the item is a Skillsoft course, the total includes time spent watching videos, working on knowledge checks, and taking tests. Time is listed as fraction of hours. Something that takes 90 minutes to complete is listed as 1.50 and something that takes 15 minutes is listed as 0.25.
- TOTAL ESTIMATED DURATION (HOURS): Total estimated amount of time it takes a learner to complete the specified content. Time is listed as fraction of hours. Something that takes 90 minutes to complete is listed as 1.50 and something that takes 15 minutes is listed as 0.25.
- TOTAL ASSETS: The number of assets contained in the track.
- TOTAL REQUIRED ASSETS: The total number of content items within the track that the learner is required to take for completion.
- STARTED: Total number of content items within the track that a learner started.
- COMPLETED: The total number of content items within the track that a learner completed.
- NOT STARTED: The total number of content items within the track that a learner has not started.
Other columns available
The following columns are also available in the Career Journey report:
- User UUID: Viewable only from the CSV download, this field is a unique identifier representing the user. It is displayed as either first and last name, email address, login ID, or external user ID.
- LOGIN NAME: The value entered in the Login name attribute for the user.
- EMAIL ADDRESS: The value entered in the Email address user attribute; the user's email address.
- TOTAL LEARNING HOURS (SECONDS): The total number of hours a learner spent learning in this content item. If the item is a Skillsoft course, the total includes time spent watching videos, working on knowledge checks, and taking tests. Time is listed in total seconds.
- TOTAL LEARNING HOURS (HHMMSS): The total number of hours a learner spent learning in this content item. If the item is a Skillsoft course, the total includes time spent watching videos, working on knowledge checks, and taking tests. Time is listed in (00h00m00s) format.