Percipio Learning - Overview Dashboard
The Overview dashboard displays several metrics about how your learners are interacting with the Percipio platform.

 Filters
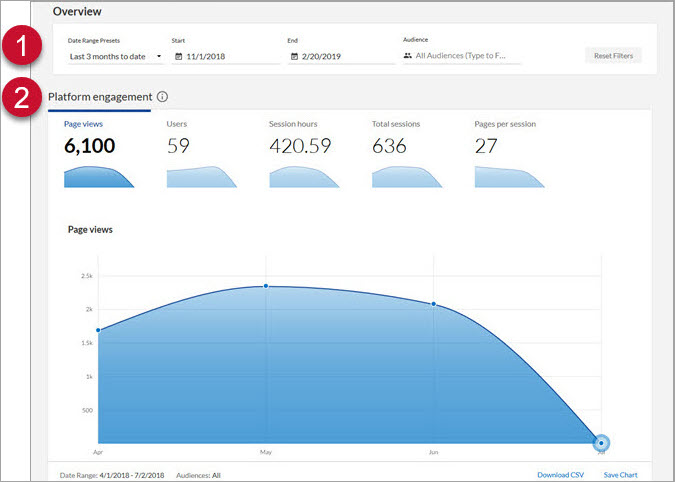
You can filter data on this dashboard by date and audience.
- Date filters: Use these to specify the data on your Activity dashboard.
- Date Range Presets: Filters the data by a specified range of dates from the drop-down list.
- Start: Instead of using a Date Range preset, use this to specify a start date. When you enter a Start date, the Date Range Presets filter changes to Custom.
- End: Instead of using a Date Range preset, use this to specify an end date. When you enter an End date, the Date Range Presets filter changes to Custom.
- AUDIENCE: Predefined group of users. Enter the name of an audience and then select it from the list. You can display the data for multiple audiences at the same time by entering more than one audience name.
Example:
If you set the date to Start on September 1 and End on October 1, only the platform data within the September 1 - October 1 time period is shown. Platform engagement chart
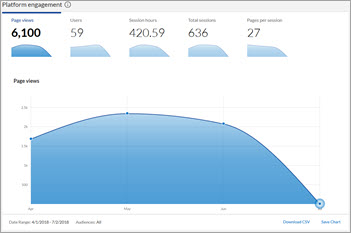
Platform engagement shows several charts related to overall usage in Percipio. When you select one of the individual metric charts, the larger graphic updates to reflect the selected data.
- Page views: Total number of platform page views for all users during the selected time frame. A page view is counted each time a user accesses a page within Percipio (whether it be through navigating through Percipio or using search).
- Examples of a page include a search results page, the Activity page, and the home page.
- Users: Total number of unique users accessing the platform during the selected time frame. Each user is counted only once, regardless of how many times they accessed the site.
- For example, if a learner signs in to Percipio four times within the specified date range, only one visit for this learner is included in this calculation.
- Session hours: Total time users spent engaged with the platform during the selected time frame.
- Total sessions: Total number of sessions during the selected time frame. This is not user-specific.
- For example, if a learner signs into Percipio four times within the specified date range, all four sessions are included in this calculation.
- You can configure how long a learner can stay logged into a session from the Settings, Site Configuration option.
- Pages per session: Average number of platform page views per user during a single session during the selected time frame.
- For example, if a learner signs in to Percipio three times during the specified time frame, and visited six pages during the first session, four pages during the second session, and eight pages during the third session, the average number of platform page views would be six (6 page views + 4 page views + 8 pages views = 18 page views. When those 18 page views are divided by the total number of sessions for the user – in this case, 3 – the average number is six.
To save or download this chart, see Working with the Overview dashboard charts.
- Page views: Total number of platform page views for all users during the selected time frame. A page view is counted each time a user accesses a page within Percipio (whether it be through navigating through Percipio or using search).
 Content entry points chart
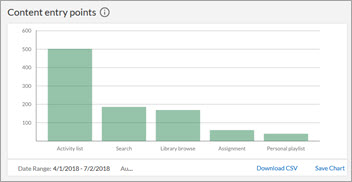
This chart displays the frequency in which learners viewed each of these content access points within Percipio.
- Activity list: Total number of time users accessed their Activity page.
- Assignment: Total number of times users accessed the assignment.
- Library browse: Total number of times users accessed browsing the library.
- Personal playlist: Total number of times users accessed the Personal playlist.
- Search: Total number of times users accessed search.
To save or download this chart, see Working with the Overview dashboard charts.
 New vs. returning users chart
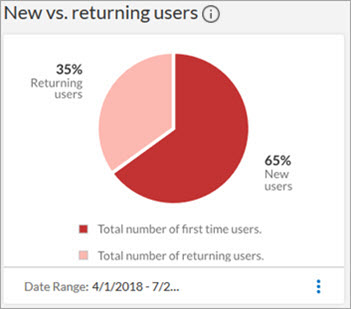
This chart displays the percentage of new versus returning users. A new user is one who logged in for the first time within the specified date range. A returning user is one who logged in prior to the specified date range AND viewed at least one page within the specified date range.
To save or download this chart, see Working with the Overview dashboard charts.
Working with the Overview dashboard charts
Save a chart
All charts on the Overview dashboard have a Save chart option, which saves the chart as a .PNG file for use in other documents (such as a slide presentation).
- Click Save Chart.
- Select Save File.
- Click OK.
- Right-click the chart image.
- Select Save picture as.
- Enter a file name.
- In the Save as type drop down menu, select PNG (*png).
- Click Save.
Download a chart's CSV file
You can download a CSV file with the selected chart metrics and use it to import the data into other business systems or documents.
- Click Download CSV.
- Follow your browser's prompts to save the file.
Related Articles
Percipio Learning - Skill Benchmarks Overview Dashboard
The Skill Benchmarks Overview dashboard shows a visual summary of your organization's proficiency of skills that have been measured by a skill benchmark. You can answer questions such as: What skill benchmarks are my learners taking? What are the ...Percipio Learning - Skill Benchmark Dashboard
The Skill Benchmark dashboard shows a visual summary of one particular skill. The data shown on this page uses the filter specified in the Skill Benchmark Overview dashboard. How to Use With this dashboard, you can gauge where your learners are on ...Percipio Learning - Assignments Dashboard
The Assignments dashboard provides insight into your assignments (including your learner engagement and associated business objectives) across your Percipio site. Filters You can filter data on this dashboard by date range and audience. Date Range ...Learning Feedback Dashboard
The Learning Feedback dashboard shows you how satisfied learners are with the content they take and whether they would recommend it to others. From this dashboard you can see the highest and lowest ranked courses as well as individual course ratings. ...Percipio Learning - Executive Dashboard (Beta Release)
The Executive dashboard is a framework for showing value and providing insights about learning success over a specified date range. It is designed to show how your people are moving along the learning journey from adoption through to achievement. ...